Power curve
Power curves and other variables acquired by data acquisition systems are very important for analyzing engine or vehicle behavior. A list of values in 100 RPM increments is easier to read than a long list in 10 RPM increments. It’s certainly shorter. But it’s important to note that this same list shown in graphic form is even easier to read if we know what to look for.
Understanding the factors that affect the results and that can mask engine failures or issues with other mechanical elements will give us a competitive advantage over those who only use value tables with 100 RPM increments.
We’ll begin by analyzing two cases sent in by our clients. We invite you to share test curves from your own dyno.
Engine Temperature and Insufficient Ventilation
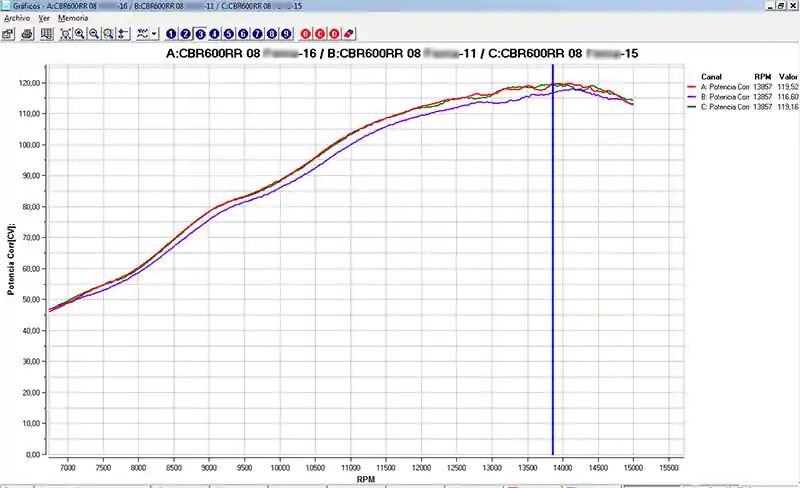
In the graph that opens this article, we can see a test performed on a motorcycle dyno. In it, we can see 3 power tests. The lower curve corresponds to the cold engine at a temperature of about 85°C. The upper curves both correspond to the hot engine at a temperature of about 100°C. We see that this motorcycle with a hot engine delivers more power: 119.52 HP and 119.16 HP. With a cold engine at the same RPM, it has a power of 116.6 HP.
Instability can also be noted at high RPM. This could be due to imbalances or tire eccentricity, but in this case, the roller is perfectly balanced and the wheels didn’t show any deformation either. The issue can be attributed to the fact that this is a test room that is still under construction and doesn’t have proper ventilation for the engine, something very important, especially in this type of motorcycle that’s designed to use air speed to force more air into the mixture. Later we’ll verify with a lambda sensor if this issue is due to the lack of forced air in this motorcycle.
Clutch Slippage

Curve with slippage
In this curve, we see the power of a 125cc 2-stroke karting engine tested on an MWD model K600i inertial flywheel. At first glance and without comparing it to another test, we can’t notice anything particular about this curve. Although we have to admit that it maintains high power over a wide range of RPMs.
If we now analyze the curves provided by our engine RPM sensor and compare them with the RPM measured at the flywheel, we’ll notice something interesting about this engine:

Transmission ratio during clutch slippage

Engine RPM vs. Roller RPM during clutch slippage
If you want to see in more detail, click on the image. In the first screen, we see that at 9,750 RPM there is a sudden increase in engine RPM relative to the flywheel RPM. The difference is subtle but high enough to produce a power drop at that point, which is precisely where the maximum torque is and where those extra horsepower could be very well utilized.
If we want to see this point in more detail, the ideal is to use the transmission ratio graph between the engine and the flywheel. This can be seen in the second graph. This line should be horizontal in an engine with this type of gearbox, but we notice that the ratio has a sharp increase and remains above the expected value between 9,600 RPM and 11,100 RPM.
This failure is probably due to a clutch problem. At the moment when the engine generates maximum torque, the clutch can’t withstand it and begins to slip. When the torque decreases, after 11 thousand RPM, the clutch engages again. This produces a lack of torque at the sprocket of this engine.
These issues can only be appreciated with extremely repetitive software that has on-screen tools for zooming, measurement cursors, and comparison. It’s also very important to have a good dyno, with solid construction, perfectly balanced, and that doesn’t have slippage or imbalances that could generate alterations in the curves that might be confused with real engine failures.
Later we’ll analyze other cases, such as a before and after of a power increase through “chipping.”